[Python.Pandas] Pivot Table과 CrossTab 사용하기
2020. 12. 28. 05:00ㆍPython과 머신러닝/Pandas 데이터 분석
1. Pandas의 PivotTable 함수
In [1]:import wget import pandas as pd import dateutil
In [2]:url = 'https://www.shanelynn.ie/wp-content/uploads/2015/06/phone_data.csv'
       wget.download(url)
       100% [..............................................................................] 40576 / 40576
Out[2]:'phone_data.csv'

In [3]:df_phone = pd.read_csv('./phone_data.csv')
       df_phone
Out[3]:

In [4]:df_phone.pivot_table(values=['duration'],
                            index = [df_phone.month, df_phone.item],
                            columns=df_phone.network,
                            aggfunc='sum',
                            fill_value=0)
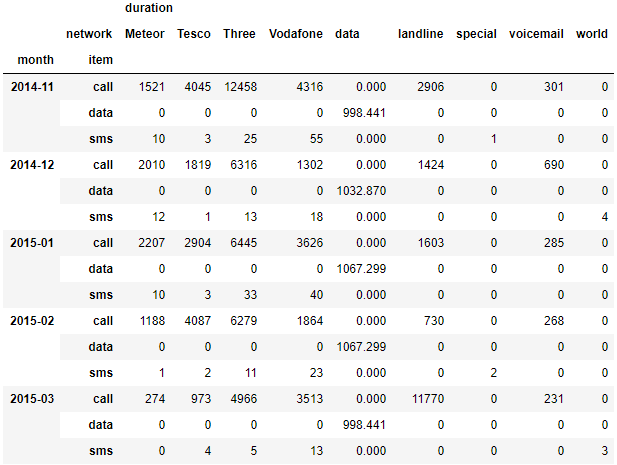
Out[4]:
- Excel에서 간편하게 데이터를 확인하고, 분류별 통계를 확인하기 위해 가장 자주 활용되는 방식이 Pivot Table이다.
- Pandas에서도 pivot_table 함수를 제공하고 In[4]와 같이 사용하면 가능하다
- Values : DataFrame의 데이터가 될 기준
- index : X축을 구분할 기준 (여러 개를 선택할 때에는 List 형태로 입력한다)
- columns : Y 축을 구분할 기준
- aggfunc : Values를 처리할 통계 방식을 선택한다 (sum을 하면 값들의 합, count를 하면 값들의 개수 등)
- fill_value = 0 : 결측치(NaN 값)가 존재할 경우, 처리방식을 지정해줄 수 있다.
2. CrossTab 이해하기
In [5]:pd.crosstab(index=[df_phone.month, df_phone.item],
                   columns=df_phone.network,
                   values=df_phone.duration,
                   aggfunc='sum'
                   ).fillna(0)

Out[5]:
- CrossTab은 Pivot Table의 일종, Pivot Table의 특수한 형태이다.
- 두 Column의 교차 빈도, 비율, 덧셈 등을 구할 때 주로 사용된다.
- In[4]와 같은 데이터를 crosstab으로 구현하려면 In[5]와 같이 parameter를 지정할 수 있다.
3. 관련 포스트
- 2020/12/29 - [Python과 머신러닝/Pandas 데이터 분석] - [Python.Pandas] Merge 와 Concat 하여 데이터 붙이기
- 2020/12/30 - [Python과 머신러닝/Pandas 데이터 분석] - [Python.Pandas] String 관련 함수 총정리 (str.upper, .replace, .isdigit, .contains, .match, .split, .rename, .get_dummies) + one hot encoding
[Python.Pandas] Merge 와 Concat 하여 데이터 붙이기
1. Merge 함수를 사용하여 데이터 합치기 In [1]:import pandas as pd In [2]:raw_data = {'subject_id':['1','2','3','4','5','7','8','9','10','11'], 'test_score':[51,15,15,61,16,14,15,1,61,16]} df_a = pd...
coding-grandpa.tistory.com
[Python.Pandas] String 관련 함수 총정리 (str.upper, .replace, .isdigit, .contains, .match, .split, .rename, .get_dummies)
1. str.upper() : 대문자로 변경하라 In [1]:import pandas as pd In [2]:raw_data = {'subject_id':['1', '2', '3', '4', '5', '6', '7', '8', '9', '10'], 'first_name':['Alex', 'Amy', 'Allen', 'Alice', 'Ayo..
coding-grandpa.tistory.com
'Python과 머신러닝 > Pandas 데이터 분석' 카테고리의 다른 글
| [Python.Pandas] String 관련 함수 총정리 (str.upper, .replace, .isdigit, .contains, .match, .split, .rename, .get_dummies) + one hot encoding (0) | 2020.12.30 |
|---|---|
| [Python.Pandas] Merge 와 Concat 하여 데이터 붙이기 (0) | 2020.12.29 |
| [Python.Pandas] Groupby 실습 / 데이터 분석 (Date/Time 데이터 분석) (0) | 2020.12.27 |
| [Python.Pandas] Groupby 이해하기 - 2편 (0) | 2020.12.24 |
| [Python.Pandas] Groupby 함수 이해하기 - 1편 (0) | 2020.12.23 |