[Python.MatPlotLib] Scatter Plot 실습
2021. 1. 4. 05:00ㆍPython과 머신러닝/MatPlotLib 데이터 시각화
0. 지난 포스트
- 2020/12/31 - [Python과 머신러닝/MatPlotLib 데이터 시각화] - [Python.MatPlotLib] MatPlotLib으로 그래프 그리기, 시각화, subplot/axes, figure
- 2021/01/01 - [Python과 머신러닝/MatPlotLib 데이터 시각화] - [Python.MatPlotLib] 그래프 꾸미기 I - 색깔 / 제목 / 선형태 지정하기와 latex식 표현하기
- 2021/01/02 - [Python과 머신러닝/MatPlotLib 데이터 시각화] - [Python.MatPlotLib] 그래프 꾸미기 II - 범례(Legend) / X,Y축 Label, 텍스트 및 화살표 / grid / ylim/ savefig
- 2021/01/03 - [Python과 머신러닝/MatPlotLib 데이터 시각화] - [Python.MatPlotLib] 그래프 꾸미기 III - 통신 데이터 분석 실습
1. 기본 Scatter Plot 그리기
In [1]:import numpy as np
       import matplotlib.pyplot as plt

In [2]:data = np.random.rand(512,2)
       data
Out[2]:array([[0.90814057, 0.74740473],
              [0.36071483, 0.27462119],
              [0.11167237, 0.66972617],
              ...,
              [0.92874536, 0.73582877],
              [0.86799693, 0.45885252],
              [0.36208703, 0.18886905]])

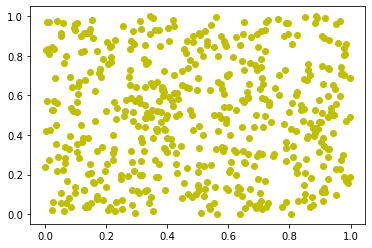
In [3]:plt.scatter(data[:,0], data[:,1], c='y')
Out[3]:
- In[2]는 512x2의 random array를 생성한다.
- In[3]는 X축 데이터를 data 배열의 0번째 column, 데이터를 Y축 데이터를 data 배열의 1번째 column을 사용하고, 색깔은 yellow로 지정하라는 의미이다.
- Out[3]와 같이 scatter plot이 그려지는 것을 확인할 수 있다.
2. Marker 지정하기
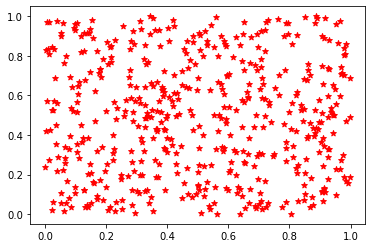
In [4]:plt.scatter(data[:,0], data[:,1], c='r', marker='*')
       #https://matplotlib.org/3.3.3/api/markers_api.html#module-matplotlib.markers
Out[4]:
- In[4]의 marker parameter를 통해 scatter plot의 종류를 지정해줄 수 있다.
- default는 '.'이고, '*'을 써서 두 가지의 데이터를 구분하여 표현할 수 있어서 자주 사용되는 기능이다.
- '.', '*' 외에도 다음과 같이 다양한 종류들이 있고, matplotlib 공식 웹사이트 링크도 첨부한다.

3. Marker Size 지정하기
In [5]:plt.scatter(data[:,0], data[:,1], c='r', marker='*', s=125)
Out[5]:
- In[5]의 s parameter를 통해서 marker의 크기를 지정할 수 있다.
- 분포도를 표현할 때, 각각의 작은 점을 여러 개 표현하기보다, marker의 크기를 조정하여 어디에 분포도가 높은 지를 표현하는 것도 효과적인 방법이다.
4. Marker Size 지정 추가 예제
In [6]:N=50
       x=np.random.rand(N)
       y=np.random.rand(N)

In [7]:area = np.pi*(15*np.random.rand(N))**2

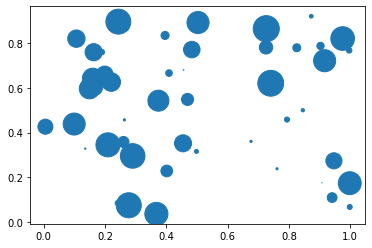
In [8]:plt.scatter(x,y,s=area)
Out[8]:
- random X, Y값에 random area를 지정하면 Out[8]과 같이 다양한 크기의 marker가 표현되는 것을 확인할 수 있다.
5. 관련 포스트
- 2021/01/05 - [Python과 머신러닝/MatPlotLib 데이터 시각화] - [Python.MatPlotLib] Histogram과 Box Plot 그리기
- 2021/01/17 - [Python과 머신러닝/MatPlotLib 데이터 시각화] - [Python.MatPlotLib] Boston Housing Price Dataset 종합 실습 (plot, subplot, StandardScaler, boxplot, Correlation Matrix)