2021. 1. 1. 05:00ㆍPython과 머신러닝/MatPlotLib 데이터 시각화
0. 이전 포스트
[Python.MatPlotLib] MatPlotLib으로 그래프 그리기, 시각화, subplot/axes, figure
1. MatPlotLib .plot 함수를 사용하여 데이터 시각화하기 In [1]:%matplotlib notebook import numpy as np import matplotlib.pyplot as plt In [2]:X = range(100) Y = range(100) In [3]:fig1 = plt.figure() p..
coding-grandpa.tistory.com
1. 실제 데이터를 기반으로 plot 그리기
In [1]:%matplotlib notebook
       import numpy as np
       import pandas as pd
       import matplotlib.pyplot as plt

In [2]:df = pd.read_csv("./phone_data.csv")
       df.head()
Out[2]: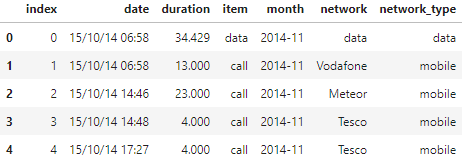
In [3]:result = df.groupby('month')['duration'].sum()
       result
Out[3]:month
       2014-11 26639.441
       2014-12 14641.870
       2015-01 18223.299
       2015-02 15522.299
       2015-03 22750.441
       Name: duration, dtype: float64

In [4]:fig1 = plt.figure(figsize=(10,10))

In [5]:plt.plot(result.index, result)
Out[5]: 
- Out[5]까지는 지난 포스트에서 정리한 내용과 동일하다. 다만 이번에는 실제 데이터를 사용해서 Plot을 그려 보았다.
2020/12/31 - [Python과 머신러닝/데이터 시각화 (MatPlotLib, Seaborn)] - [Python.MatPlotLib] MatPlotLib으로 그래프 그리기, 시각화, subplot/axes, figure
2. 그래프 색깔 지정하기
In [6]:fig2 = plt.figure(figsize=(10,10))

In [7]:plt.plot(result.index, result, color='#000000')

In [8]:plt.plot(result.index, result, color='b')
Out[8]:

- 그래프의 색깔을 지정하는 것은 두 가지 방식이 있다.
- RGB 값 지정하기(In[7])
- color='#001122'라고 지정하면, Red = 0x00 / Green = 0x11 / Blue = 0x22의 색깔로 그래프를 그리라는 것이 된다.
- Out[7]은 가져오지 않았지만, In[7]의 colors='#000000'은 검은색과 같아서 검정색 그래프가 그려지게 된다.
- 나와 같이 미적 감각이 뛰어나지 않은 사람들은 자주 사용하지 않지만, 정확하게 원하는 색깔이 있다면 RGB 값을 16진수로 변환하여 지정해줄 수 있다.
- 색깔의 initial로 지정하기 (In[8])
- color='b'는 blue를 의미하고, 그렇기 때문에 Out[8]과 같은 결과물이 나온다.
- MatPlotLib에서 지정한 색깔은 다음과 같다.
- b: blue
- g: green
- r: red
- c: cyan
- m: magenta
- y: yellow
- k: black
- w: white
- RGB 값 지정하기(In[7])
- 색깔과 관련된 더 자세한 내용은 다음 링크에서 확인할 수 있다 : matplotlib.org/2.0.2/api/colors_api.html
3. Line Style 지정하기 1
In [9]:fig3 = plt.figure(figsize=(10,10))
       plt.plot(result.index, result, c='b', linestyle='dashed')
Out[9]:

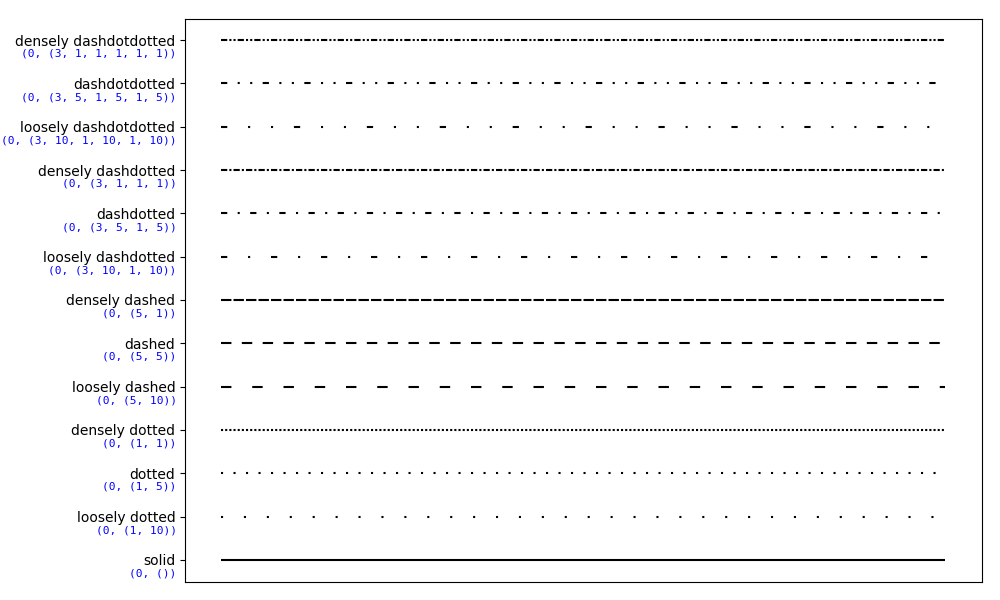
- plt.plot() 시 linestyle을 'dashed'로 지정해주면, 직선이 아닌 대시선(?)으로 그래프를 그릴 수 있다.
- 주로 사용되는 타입은 dashed, dotted, default(미지정) 정도인 것 같지만, 미적 감각을 뽐내고 싶을 사람들을 위해 matplotlib의 공식 사이트에서 다음 사진을 퍼왔다.
4. Line Style 지정하기 2
In [10]:fig4 = plt.figure(figsize=(10,10))
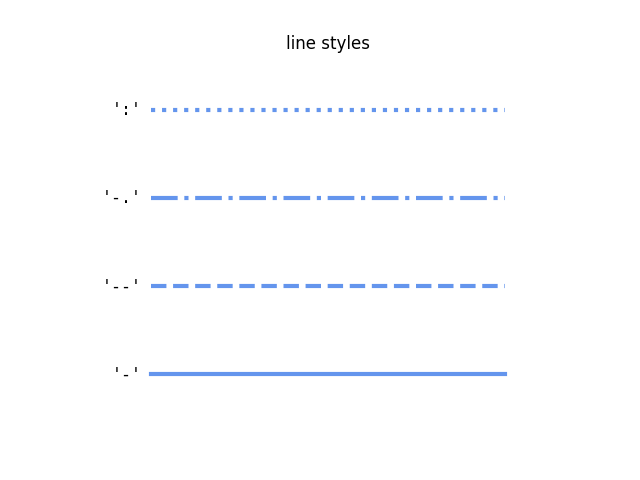
plt.plot(result.index, result, c='k', ls='--')
Out[10]:
- Line Style을 지정할 때에는 dashed라고 전부 적기 귀찮을 때도 있다.
- 그럴 때는 ls='--'등의 줄임 표현으로도 지정이 가능하다.
- Matplotlib 공식 사이트에서 나오는 참고자료를 첨부한다.
5. 제목 지정하기 1
In [11]:plt.title("Durations per Month")
Out[11]:

- plt.title()이라는 함수를 통해서 plot의 제목을 지정해줄 수 있다.
6. 제목 지정하기 2 (Latex 식 표현)
In [12]:plt.title('$y=\\frac{ax+b}{test}$')
Out[12]:

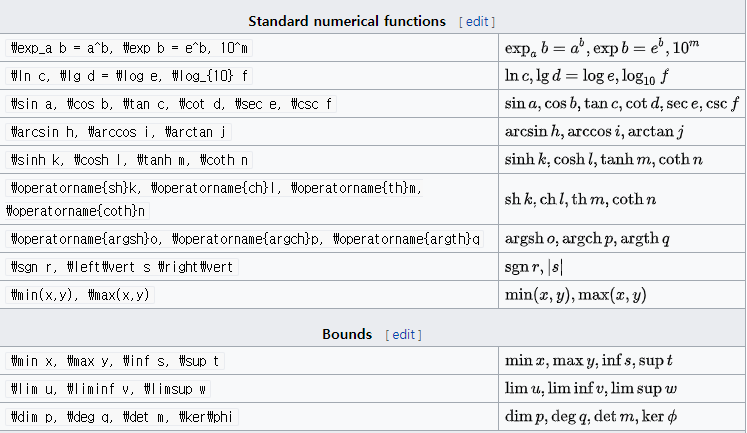
- plt.title에 '$ $'사이에 값을 넣을 경우, latex 식 수식 표현이 가능하다.
- 복잡한 수학 기호를 꼭 넣고 싶다면, latex 식으로 넣는 것이 가독성이 훨씬 좋아지기 때문에, 이 기능도 종종 필요한 경우들이 생긴다.
- 기본적인 수학공식들은 다음 wikipedia 스크린샷에서 참고할 수 있고, 더 자세한 내용은 아래의 링크를 따라가면 전부 확인할 수 있다.
7. 관련 포스트
- 2021/01/02 - [Python과 머신러닝/MatPlotLib 데이터 시각화] - [Python.MatPlotLib] 그래프 꾸미기 II - 범례(Legend) / X,Y축 Label, 텍스트 및 화살표 / grid / ylim/ savefig
- 2021/01/03 - [Python과 머신러닝/MatPlotLib 데이터 시각화] - [Python.MatPlotLib] 그래프 꾸미기 III - 통신 데이터 분석 실습
- 2021/01/04 - [Python과 머신러닝/MatPlotLib 데이터 시각화] - [Python.MatPlotLib] Scatter Plot 실습
- 2021/01/05 - [Python과 머신러닝/MatPlotLib 데이터 시각화] - [Python.MatPlotLib] Histogram과 Box Plot 그리기
- 2021/01/17 - [Python과 머신러닝/MatPlotLib 데이터 시각화] - [Python.MatPlotLib] Boston Housing Price Dataset 종합 실습 (plot, subplot, StandardScaler, boxplot, Correlation Matrix)
[Python.MatPlotLib] 그래프 꾸미기 II - 범례(Legend) / X,Y축 Label, 텍스트 및 화살표 / grid / ylim/ savefig
1. 지난 포스트에 이어 지난 포스트에서 MatPlotLib 기초와 그래프 꾸미기 1을 정리했다. 여기서 사용되는 phone_data.csv를 인터넷에서 다운로드하여 사용하는 코드도 다른 포스트에서 정리하여 함께
coding-grandpa.tistory.com
[Python.MatPlotLib] 그래프 꾸미기 III - 통신 데이터 분석 실습
0. 지난 포스트에 이어 지난 몇 차례의 포스트에 이어 MatPlotLib 그래프 꾸미기 실습을 진행할 예정이다. 통신 데이터를 기반으로 날짜별/통신사별 통신량을 분석하고자 한다. 우선은 데이터를 pand
coding-grandpa.tistory.com
[Python.MatPlotLib] Scatter Plot 실습
1. 기본 Scatter Plot 그리기 In [1]:import numpy as np import matplotlib.pyplot as plt In [2]:data = np.random.rand(512,2) data Out[2]:array([[0.90814057, 0.74740473], [0.36071483, 0.27462119], [0.11..
coding-grandpa.tistory.com
[Python.MatPlotLib] Histogram과 Box Plot 그리기
1. Histogram 그리기 In [1]:import numpy as np import matplotlib.pyplot as plt In [2]:x = np.random.randn(1000000) In [3]:plt.hist(x, bins=10000) Out[3]:(array([1., 0., 0., ..., 0., 0., 1.]), array([..
coding-grandpa.tistory.com
'Python과 머신러닝 > MatPlotLib 데이터 시각화' 카테고리의 다른 글
| [Python.MatPlotLib] Histogram과 Box Plot 그리기 (0) | 2021.01.05 |
|---|---|
| [Python.MatPlotLib] Scatter Plot 실습 (0) | 2021.01.04 |
| [Python.MatPlotLib] 그래프 꾸미기 III - 통신 데이터 분석 실습 (0) | 2021.01.03 |
| [Python.MatPlotLib] 그래프 꾸미기 II - 범례(Legend) / X,Y축 Label, 텍스트 및 화살표 / grid / ylim/ savefig (0) | 2021.01.02 |
| [Python.MatPlotLib] MatPlotLib으로 그래프 그리기, 시각화, subplot/axes, figure (0) | 2020.12.31 |